Friday, September 22, 2017
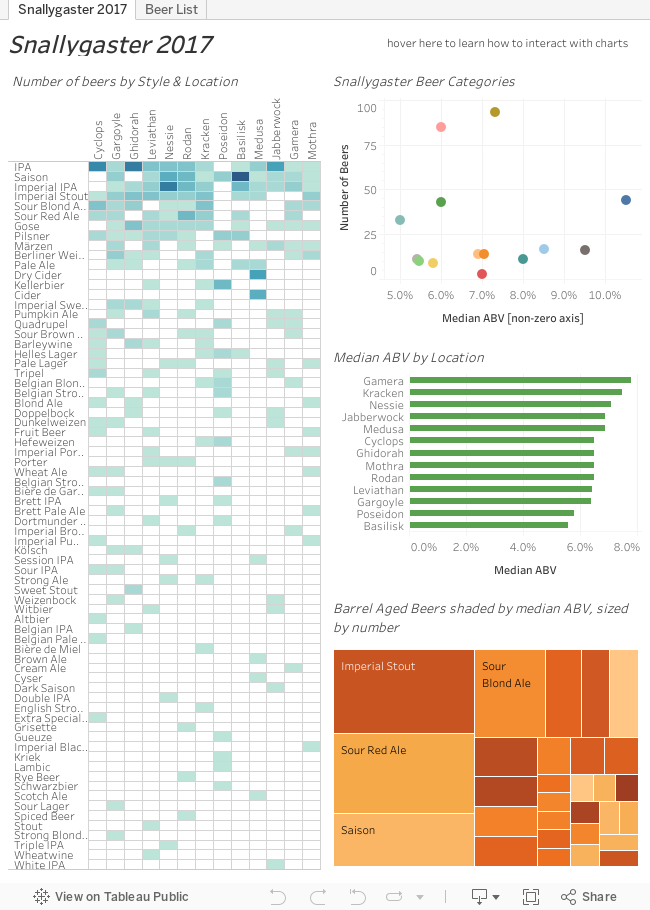
Snallygaster 2017
Snallygaster is one of the best beer festivals in the Mid-Atlantic region and I am grateful that they publish their list of beers in a handy excel sheet so dataviz geeks like me can play with it.
Thursday, September 15, 2016
Snallygaster Beer Finder Dataviz
Snallygaster is the best beer festival in the DC metro area. There is no doubt about this. Not only are there hundreds of delicious beers, but the event is to raise money for the local urban gardening non-profit Arcadia. (Yes, please click on that link and check out what they do.)
The map of the US has zoom controls that appear in the corner when you hover over the map. This way you can better zoom in to the east coast where most of the beers originated. By the way Virginia breweries (including collaborations) are bringing the most beers to the event on Saturday. However, each collaboration is treated as a unique brewery so keep that in mind as you are perusing the list and analyzing the results of your "analysis."
For those of you who might be looking for lower ABV beers (there is no shame in that whatsoever) you can use the ABV distribution chart. Not only can you click on the individual bars to view the beers with that ABV, but you can hold the ctrl key while selecting additional bars, or draw a box around the ABV bars you want to select.
As you can see there are lots of ways you can interact with this beer finder dataviz. However, it is best viewed on a monitor, laptop, or a tablet. You can try it on your smart phone, but it might be difficult to select and view the entire viz at once.
See you Saturday at Snallygaster!
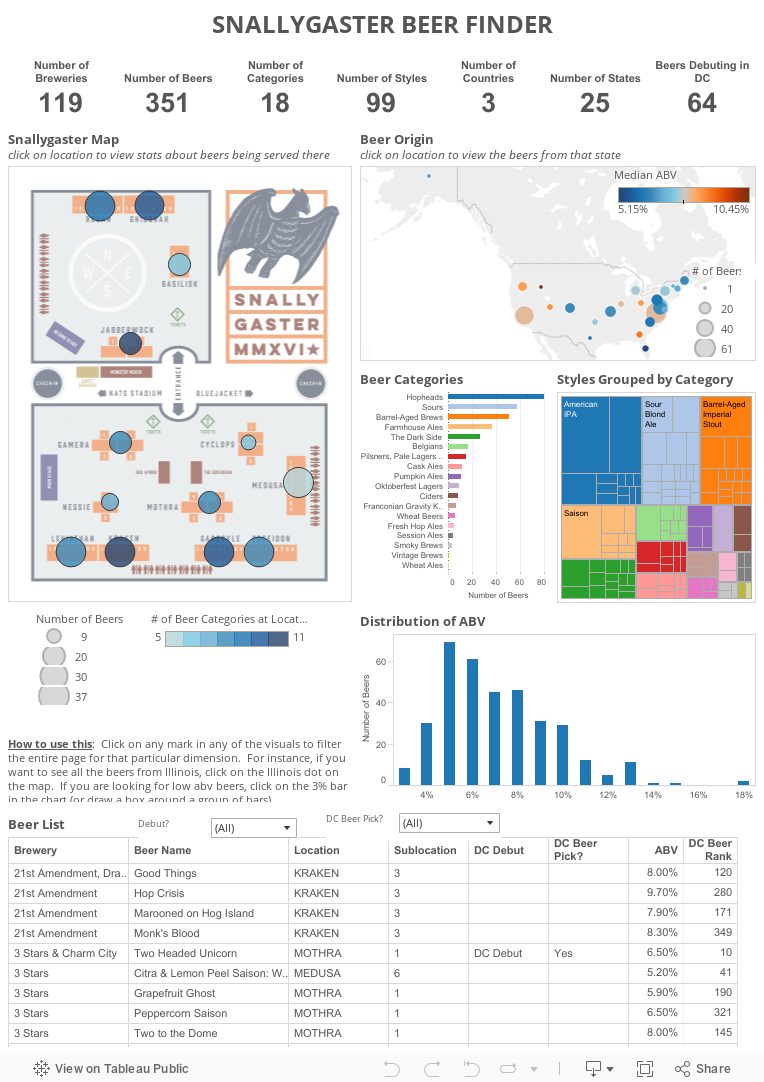
If you haven't been to Snallygaster and love great beer, you are missing out. This year, there are nearly 100 different styles of beers from 120 different breweries (including collaborations). These beers are spread across 13 different stations located in the parking lot across from Nationals Park. With this much territory to cover and all these beers to sort through, figuring out what you want to drink can be daunting. That is why I created this interactive beer finder dataviz.
The Snallygaster organizers have been kind enough to provide a list of the beers and all the associated details via a Google docs spreadsheet. I downloaded the list of beers as well as the map of the Snallygaster site. As you can see below, the list of beers combined with the map of the layout of the event, provides an opportunity to explore the world of Snallygaster beers and figure out where you want to be to get the beers you want on Saturday.
How this works
Everything in the dataviz above is interactive. You can click on a location on the Snallygaster map and see what kind of beers, their origin, their ABV, styles, and even if they are debuting in DC. When you hover over the different marks in the charts above, you will also see additional information (such as the number of breweries for each of the categories and styles). If you are someone who needs to be "the first" and always has to try something new, then you can use the "Debut?" filter (located at the top of the beer list) to choose just the beers that are debuting in DC. If you have a favorite brewery, you can find the brewery in the list at the bottom of the viz and click on the name. Then you can see where all the beers from the brewery are on the Snallygaster map.The map of the US has zoom controls that appear in the corner when you hover over the map. This way you can better zoom in to the east coast where most of the beers originated. By the way Virginia breweries (including collaborations) are bringing the most beers to the event on Saturday. However, each collaboration is treated as a unique brewery so keep that in mind as you are perusing the list and analyzing the results of your "analysis."
For those of you who might be looking for lower ABV beers (there is no shame in that whatsoever) you can use the ABV distribution chart. Not only can you click on the individual bars to view the beers with that ABV, but you can hold the ctrl key while selecting additional bars, or draw a box around the ABV bars you want to select.
As you can see there are lots of ways you can interact with this beer finder dataviz. However, it is best viewed on a monitor, laptop, or a tablet. You can try it on your smart phone, but it might be difficult to select and view the entire viz at once.
See you Saturday at Snallygaster!
Tuesday, September 23, 2014
Silk, Pie Charts, and NFL Arrests
I stumbled into an interesting conversation yesterday on Twitter between a friend of mine and the twitter handle for Silk.co. For those of you not familiar with Silk, it is a website that aggregates datasets that are relevant to current trends and events and provides some simple and easy to use data visualization tools for creating a stories using their data sets.
It all started when Silk published this tweet yesterday afternoon with a chart created from their site using a dataset of NFL arrests since 2000.
It all started when Silk published this tweet yesterday afternoon with a chart created from their site using a dataset of NFL arrests since 2000.
Wednesday, March 12, 2014
A look at salaries for City of Annapolis employees
It is budget time for the City of Annapolis. The new mayor, Mike Pantelides, has proposed a series of job eliminations, furloughs, and lay-offs for the City of Annapolis. The local Annapolis newspaper, The Capital, has done a great public service by publishing the salaries for city employees. And even though I know most of the information is public record, I do have to disagree with their publishing the individual's name alongside the salary data. I think it would have been sufficient to just publish each position without the name or with a non-traceable ID. But I took the data they provided and turned it into a data visualization that you can explore to see exactly which departments comman the highest salaries and employ the most individuals in the city.
Thursday, March 21, 2013
I can't really call it a hiatus...
because I do not post on a regular basis. When I first started this blog, I thought I would be posting at least once a month. But in reality I was doing it about once in a while. And over time I found myself doing more and more hockey related viz.
Consequently, I have been asked to post a weekly column for St. Louis Game Time (a fan run St. Louis Blues hockey blog). This opportunity has created additional opportunities related to hockey data visualization.
I have also been asked to contribute data viz for my organization's website!
So if you are interested in continuing to follow my work, please check out my posts at St. Louis Game Time and keep your eye on the front page of USGBC.org every third and fourth week of the month.
I hope to be back here posting on a semi-regular basis again after the hockey season ends.
Thank you all for reading!
Tuesday, February 19, 2013
Thank you for putting me in the top 1% of Tableau authors!
I received an email from Tableau today. It thanked me for being in the top 1% of Tableau Public authors. Really...I'm in the top 1% of Tableau Public authors? That is pretty fantastic and I have all of YOU to thank for it. I really have appreciated all the support I've received from friends, colleagues, and fellow Tableau users. Many of you have RT my postings on Twitter. Some of you have posted a link to my blog on your site. Whatever the case may be, I am grateful for all the support, feedback, and visitors I have received at this site.
Sunday, February 17, 2013
Hockey Day Across America 2013
Last year for Hockey Day Across America, I took a look at the birthplaces of NHL players whose teams were playing on Hockey Day Across America. I decided to update the visualization this year but just focusing on the number of US born players that are currently playing in the NHL during the abbreviated 2012-2013 season.
Subscribe to:
Posts (Atom)