FDIC Bank Closings -- Tableau Demo for Work
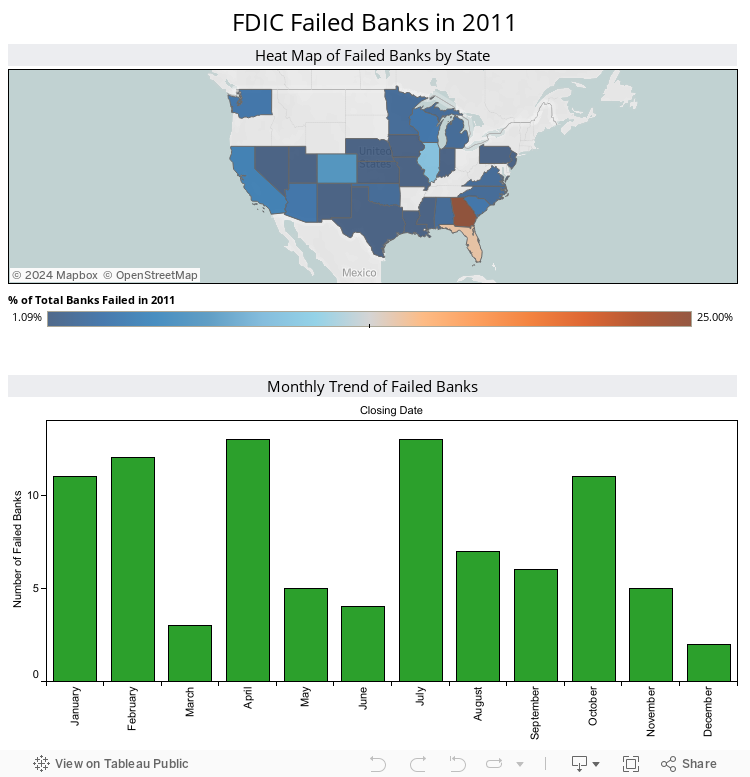
Some of the staff where I work are interested in a demo of Tableau. Basically they want to know what it is, how does it work, and how we are using it. So I downloaded the FDIC Failed Banks list from Data.gov and used this data set to show them how easy it is to create a quick interactive data visualization that can be embedded into a blog post. I actually made this right in front of them as part of the demo. It took about 10 minutes max.
Nothing fancy, and there are others who have done this as well, but it is a heck of a lot better than my previous viz using this same data. This actually makes me happy because I hope it is showing a certain level of growth in my skills and understanding of data visualizations.
Robert,
ReplyDeleteI have been looking for a good way to give someone a demo of Tableau internally. I tend to lean towards internal data since it's more applicable to the audience.
What's your take? Why did you choose the FDIC data instead of internal data?
Andy
Andy,
ReplyDeletePart of the demo was to demonstrate not only how easy it was to put together a clean looking viz, but also the ease of embedding it into a blog posting. So instead of using internal data and having to deal with issues of "can you post this data publicly?" I just used publicly available data.
Not to mention, the data we use here (like in most places I would assume) is not the cleanest and always has caveats, null values, etc. I wanted a nice, clean, simple data set that had a variety of data which is what the FDIC list provided (location, time series, etc). That way I could focus on creating the viz from scratch right in front of him during the demo without having to do all the extra work that is sometimes required when I work with internal data.
Robert
We have made a slightly different visualization on our site here: http://www.fta-llc.net/services/strategic-technology-planning-and-management/business-intelligence-and-data-visualization/
ReplyDeleteThe differences are:
a. The years are from 2000-2013
b. Underlying the graph, there is a visualization of household growth - so, there is an attempt to show correlation or lack thereof, of household growth with failed banks.